Download the white paper here »
Our clients—like many investors—perceive that equity long/short hedge funds have, on average, not done a very good job of either hedging market risk or beating broad passive equity indices following the end of the Great Financial Crisis and the beginning of the subsequent bull market. Those perceptions are correct and spur a question that we seek to answer in our White Paper No. 67: why bother with equity long/short at all? In this white paper, we look at how to measure value creation in a portfolio context and identify some cases where it can still make sense to use equity long/short hedge funds.
Greycourt has a healthy skepticism about the role of equity long/short hedge funds in investment portfolios. Performance today is dramatically different than in the heyday for these funds, and while they can add diversification and risk reduction in an investor’s portfolio, they can also experience losses during equity market drawdowns, precisely when investors look to hedged strategies for support. It prompts the question: why bother?
To provide context for this question, we outline the decline in performance of equity long/short funds over the past three decades. Weaker performance may have resulted from increased competition, changes in how market information is accessed and processed, the rise of systematic strategies that sop up alpha, and emerging challenges in establishing and maintaining short positions.
Given this paradigm shift in performance, it is important to ask: what should we try to achieve from owning equity long/short managers? Do we want to reduce the equity market sensitivity of a portfolio? Are we looking to enhance portfolio efficiency (i.e., more return relative to risk)? Are we pursuing the skill of a specific manager?
In this Greycourt White Paper, we outline a framework for defining expectations for risk and return that can support the optimal use of equity long/short hedge funds. We conclude that some high-quality equity long/short funds can indeed provide incremental benefits in a diversified portfolio. There are two important caveats to our work in this memo. First, taxable investors must apply another level of analysis to determine if after-tax returns are attractive. Second, we are addressing in this memo the world of mid-to-high-net exposure equity long/short hedge funds using modest leverage. We do not address higher-leverage, low-net exposure equity long/short strategies nor “diversifying” strategies that rely on arbitrage, relative value, event driven strategies, etc.
Charts A and B illustrate the longer-term performance for the HFRI Equity Hedge Index (HFRI EH), the Bloomberg Barclays Aggregate Index, and the MSCI ACWI.
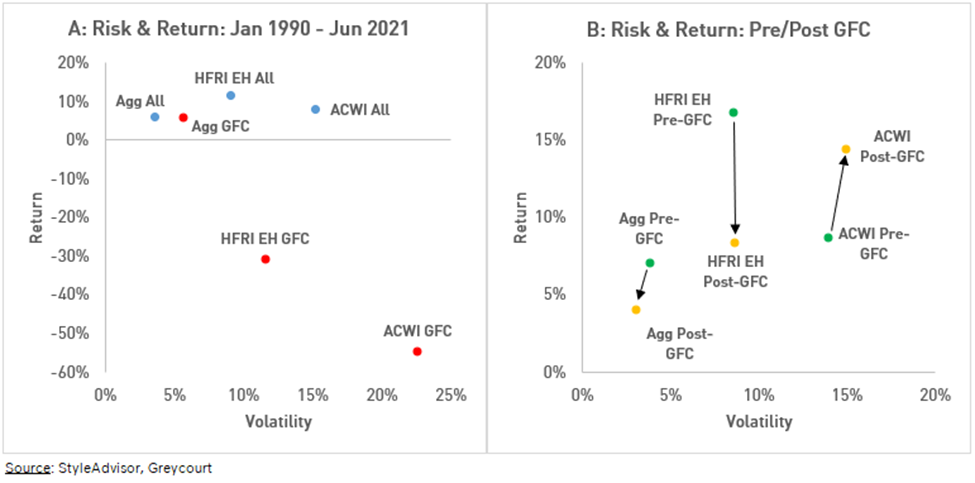
In Chart A, it is clear that equity long/short funds were a better place to be invested for the whole period (blue dots; annualized). They experienced large drawdowns during the Great Financial Crisis (GFC) (red dots; Nov. 2007 – Feb. 2009), but protected capital relative to the global equity ACWI index.
However, if we separate the analysis into Pre-GFC (green dots; ending Oct. 2007) and Post-GFC (yellow dots; starting Mar. 2009) time periods, Chart B shows that equity long/short funds have not been able to beat the equity market since the trough of the GFC.[1]
In fact, investors could have simply created an equity/bond portfolio and beat the hedge funds with the same level of volatility, and without the K-1 hassles, illiquidity, and fees. So why bother with long/short funds at all? Equity long/short funds can be used to modulate risk in a broader portfolio since they typically carry lower volatility than equities. But that’s not enough, given their performance disadvantage.
[1] For a robust statistical analysis of changes in hedge fund index performance, see: Sullivan, Rodney N. Winter 2021. “Hedge Fund Alpha: Cycle or Sunset?” The Journal of Alternative Investments 23 (3): 55-79.
Investing involves risks and you may incur a profit or a loss. Past performance is no guarantee of future results.
The key to using long/short funds successfully is to seek funds that generate an uncorrelated return beyond that associated with their level of market risk. In other words, a long/short fund with a 40% exposure to the market that generates a return greater than 40% of the market return while offering a unique source of diversification is useful and desirable.
Below, we outline a framework for assessing the overall contribution of long/short funds to a portfolio, addressing the question, “What do I have to believe, in order to invest successfully in equity long/short funds?”
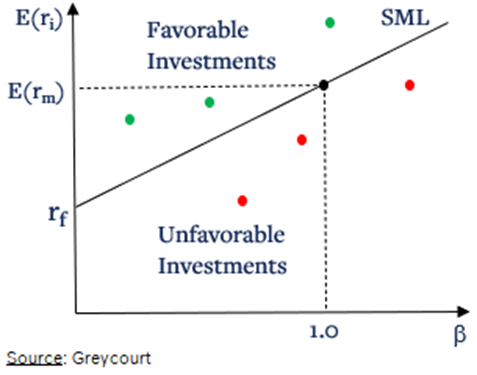
A Framework: The Security Market Line (SML)
Our framework begins by constructing a “Rate of Return” (RoR) benchmark to measure whether or not a fund is generating an excess return over its market exposure. The RoR benchmark combines the fund’s net market exposure with an exposure to the risk-free rate, summing to 100%. If a fund has 120% long exposure and 70% short exposure, and the long and short positions have the same sensitivity to market risk, then the overlap of the short exposure over the long exposure would cancel out that portion of any market risk. The fund would have a positive net exposure of 50% (120% – 70%).
Of course, we expect equity long/short funds to profit from every dollar they invest, long or short, rather than obtaining returns solely via their net exposure alone. However, we believe that the opportunity cost for investing in equity long/short funds is best measured by their net market exposure.
The precise manner of creating the RoR benchmark and relating it to portfolio theory is illustrated in Exhibit A in the appendix for those readers with an interest in the math. But the concept itself is straightforward:
Now that we have developed the SML framework we can examine how equity long/short funds have done in the past and decide what we should require from them in the future.
Asset Class Case
Over the ten years through June 2021, the HFRI EH Index generated an annualized return of 6.5% with a beta of 0.57 to the S&P 500, which itself generated an annualized return of 14.8%. The HFRI EH Index did not beat the market and, using a risk-free rate of 0.6% per year, we can determine that the Index fell 2.2 percentage points below the SML (6.5% – (0.6% + 0.57 x (14.8% – 0.6%))).
If instead of the S&P 500 we use the MSCI ACWI, we find that the HFRI EH Index is above the SML by 0.5 percentage points. Against either a US or global backdrop, we conclude that the Index did not generate a substantial level of alpha, if any, on a pre-tax basis.
Skill Case
Next, we examine the case for individual funds by examining the results of seven funds selected by Greycourt for this analysis. This selection was based on the level of information available to Greycourt to assess the strategy as consistent with this discussion. We acknowledge that studying the historic performance of individual funds is fraught with the risk of selection bias, but we believe that there is enough dispersion around mean results to justify hunting for outliers.
The following table outlines historical pre-tax results over a five-year period ending June 2021 for six equity long/short funds and the equity long/short book for a fund of funds. Fund B is shown net of underlying manager fees and carry, but gross of the fund of fund fees; all other funds are net of all manager fees and carry. The funds are measured against the benchmark most relevant to the strategy pursued: the S&P 500 Index for all funds except for Fund A, which uses the Russell 2500 Index, and Fund F, which uses the MSCI Asia Pacific Index (local). Five out of the seven funds beat the SML, generating annual alpha well over 100 basis points.
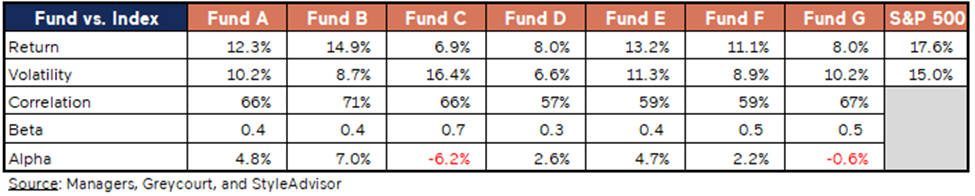
In this admittedly small sample, five out of seven funds selected are providing incremental benefits in an equity portfolio, residing above the SML. In other words, it is possible for equity long/short funds to add real value even in what is clearly a tougher post-GFC world.
It is also useful to apply expected returns to the SML to create a forward-looking required rate of return for equity long/short funds. We start with Greycourt’s ten-year strategic return assumption for global equity markets, which is 6.9%[1]. Using the ten-year Treasury constant maturity yield (as of 6/30/2021) of 1.5% as the risk-free rate, and assuming the average long/short fund beta is 0.40, we get a required return of 3.6%. While this appears to be a low required return, we expect equity returns to be compressed looking forward relative to the levels achieved over the prior decade.
[1] Investing involves risks and you may incur a profit or a loss. Past performance is no guarantee of future results. Examples are shown for illustrative purposes only and are not provided to be indicative of the frequency or likelihood of success among long/short strategies. Results for other managers will have varied widely over the same period. Please see the Disclosures for important additional information.
Our framework assumes that betas are stable, but equity long/short funds tend to have variable market betas, notably during market drawdowns. The table shown in Exhibit B in the appendix outlines eight loss periods for the S&P 500 in the last ten years, along with the ratio of each example fund’s return to the S&P 500. All of the funds show some variability, and often increased sensitivity to market moves relative to their average betas, precisely when it is undesirable.
Of all the drawdowns over the past decade, January 2021 represents a special case. By now, most people are familiar with the sequence of events: a short squeeze in GameStop, led by frenzied online communication between retail investors on Reddit and Twitter, catalyzed additional short squeezes, forcing managers affected by the short squeezes to reduce single name short positions and to liquidate long positions to fund margin calls—the very definition of an unpalatable feedback loop.
[3] Investing involves risks and you may incur a profit or a loss. Past performance is no guarantee of future results. Examples are shown for illustrative purposes only and are not provided to be indicative of the frequency or likelihood of success among long/short strategies. Results for other managers will have varied widely over the same period. Please see the Disclosures for important additional information.
Ultimately, the equity long/short industry as a whole began to take down overall gross exposure, especially where managers had crowded into common names, both long and short. The final phase is outlined graphically below, showing the level of de-risking relative to past events in terms of gross exposure. In this case, it is represented by the blue line which measures how fast and how far gross exposure is moving away from its running (cumulative) average.
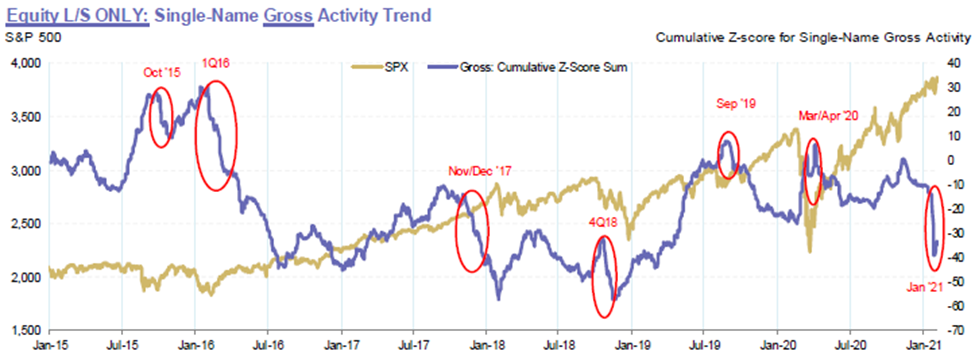
January 2021 serves as a powerful illustration of two related forces that drive variable beta: an individual fund’s underlying positions may undergo changes in the beta of each long and short position during drawdowns, and this may be exacerbated by the reactions of other portfolio managers trying to correct for related security price changes during a drawdown, including by reducing gross exposure.
January 2021 also brought renewed attention to the viability of maintaining a book of single-stock short positions, generating the following questions:
To the extent that some managers may replace single name shorts with index shorts to avoid short squeezes, they are likely limiting their toolkit for generating alpha. On the other hand, portfolio managers that are committed to maintaining a significant single name short book must master tools to manage various new risks. These include tools for monitoring online chat forums and scanning for any companies that may become susceptible to a short squeeze.
We do not believe it will become persistently more costly to enter into short positions or that it will become harder to find shares for shorting. On the contrary, we have heard from some managers that it may become less competitive to access single name shorts under current conditions.
We also do not believe regulators will make any moves to eliminate the ability of funds to pursue short positions. The long history of shorting demonstrates its importance in driving price discovery for the maintenance of efficient markets. Certain shorting bans were (largely temporarily) enacted during the Great Financial Crisis and there has been debate around whether or not such bans were ultimately helpful to the markets.
We note above that some investors desire equity long/short funds for their relatively lower volatility and lower correlation. However, we have demonstrated that not only do some funds not generate more return relative to the market risk taken, but in some cases investors may get more market risk exposure from their funds exactly when they do not want it. Notwithstanding these serious challenges, it is empirically true that some equity long/short funds can and have added incremental value to an equity portfolio, but it happens on average over a long timeframe.
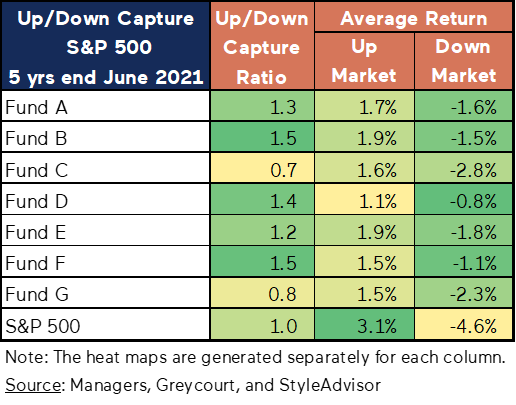
One way to examine how managers seek to optimize their risk/return profile over time is through up/down capture ratios that look at long-term performance records. Using the same sample of funds as above, the following table shows that managers residing above the SML generally have had a higher up capture versus down capture (represented by a ratio above 1.0) and these managers also have tended to make more money in up markets than they lose in down markets. Taken together, they have favorable attributes with respect to their market exposure on average, but – and it’s a very big “but” – investors may be disappointed if they expect long/short funds to be a strong hedge for the rest of their portfolio during abrupt market drawdowns. In other words, “hedge funds don’t always hedge.”
We now revisit our performance measurement framework and ask the question, “Given that alpha is measured alongside beta, what does alpha look like when beta is variable?” To answer this question, we estimate the funds’ alphas and betas versus the S&P 500 on a calendar year basis. We begin by illustrating the variability of fund betas by calendar year below.
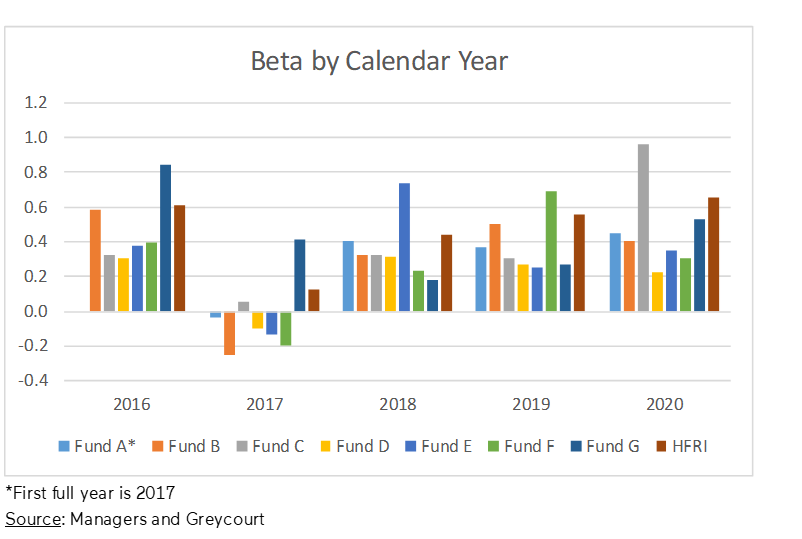
All of the funds show some variability in their market risk sensitivity, suggesting that allowing beta to vary by using smaller time windows is probably a good idea when measuring alpha. The year 2017 stands out as a period when all of the funds showed a low or even negative market beta. A possible cause for this is the persistently low correlation between individual stocks that year. Low correlation can open up the opportunity set for managers to find compelling ideas in both long and short opportunities, enhancing the ability to differentiate themselves from the market.
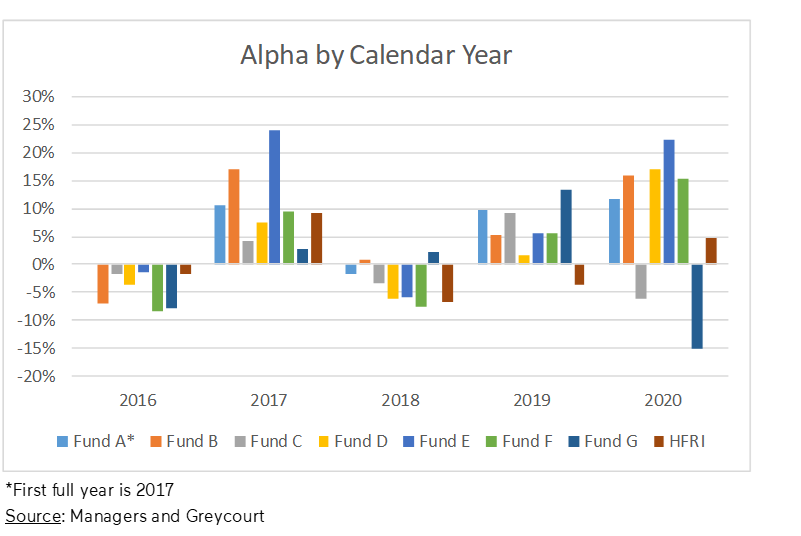
Next, we illustrate the alpha generation for each manager by calendar year in the following chart. It is clear that managers share a common sensitivity to the market environment in terms of when they are better or worse at generating alpha. It also evident that the low correlation among individual companies in 2017 fostered an environment of alpha generation. It should be noted that, while there was a huge spike in correlation in early 2020, it declined sharply over the course of the year.
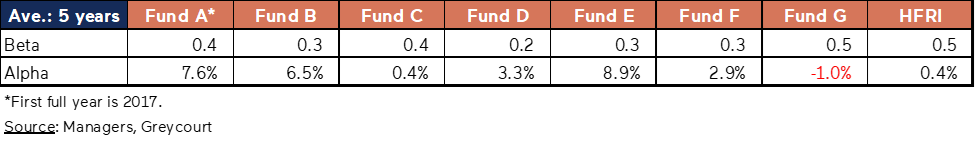
While alpha has been negative in some environments, we display the average alphas across the five calendar years below to illustrate the long-run trajectory. The average alphas are higher than those shown in an earlier table, but this is a slightly different time window that does not include the challenging performance of January 2021. In general, the average calendar year results still suggest a positive impact in equity portfolios for most of the funds.
In summary, while hedge funds may experience variable levels of market risk under changing market conditions, on average over long periods of time they can add value.
Looking ahead, investors should consider a potential environment of compressed equity market returns and high quality long/short funds to be more meaningfully accretive on a relative basis. This of course begs the question whether alpha will be higher or lower in such an environment, but we leave that to further research.
To synthesize, we think that investors having one or more of the following perspectives can sensibly defend allocating a portion of a portfolio to equity long/short funds:
In any event, we propose using a proper performance measurement framework such as the security market line-based framework can help identify when a particular equity long/short fund has generated meaningful incremental portfolio benefits.
While the average performance of equity long/short hedge funds has declined over the last few decades, our SML framework shows that the bar for generating incremental value for equity portfolios is lower than investors may think. That said, investors need to maintain a realistic perspective. We do not expect equity long-short strategies to “beat” equity markets outright. Further, variable beta and alpha mean that, even for funds that can generate long-term returns in excess of their market risk, the benefits do not always occur when you think they will. Finally, the hedging in hedge funds is not always (or even often) going to occur during sharp downdrafts.
These challenges notwithstanding, equity long/short strategies are not useless. Investors must set clear goals for allocating to equity long/short strategies and be prepared for these strategies to move with the market to some degree in abrupt drawdowns. Investors can monitor both alpha and beta over time to determine the degree to which they are meeting their goals and, relatedly, how and when to make changes elsewhere in a portfolio to intentionally amp up missing equity beta.