Download the white paper here »
“Apples & Oranges” explores valuation differences between US stocks (S&P 500) and developed non-US stocks (EAFE) to see if the latter is as cheap as it first appears.
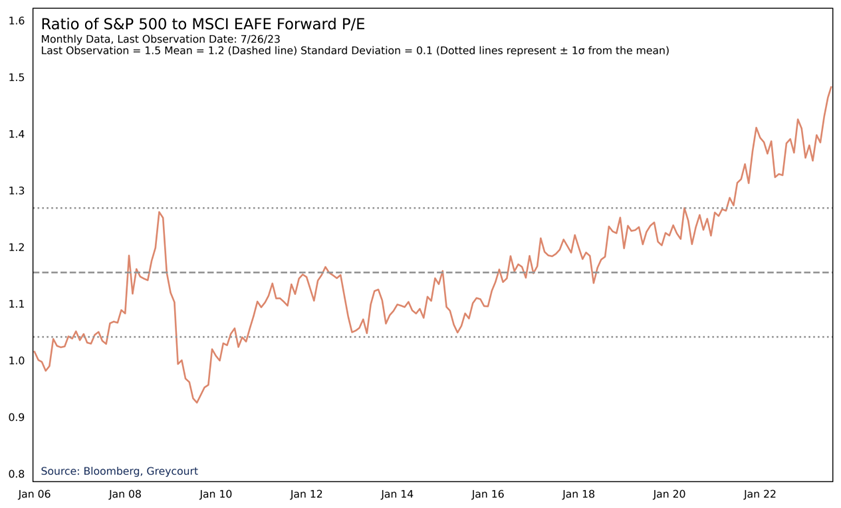
Investors often compare the relative attractiveness of the US equity market as represented by the S&P 500 index with non-US equity markets as represented by the MSCI EAFE index. At first glance, EAFE appears historically cheap compared to the S&P 500, especially when comparing their respective forward P/E ratios. But comparing US and non-US markets is not that straight forward. There are meaningful differences between the construction of the two indices that can make a simple comparison misleading.
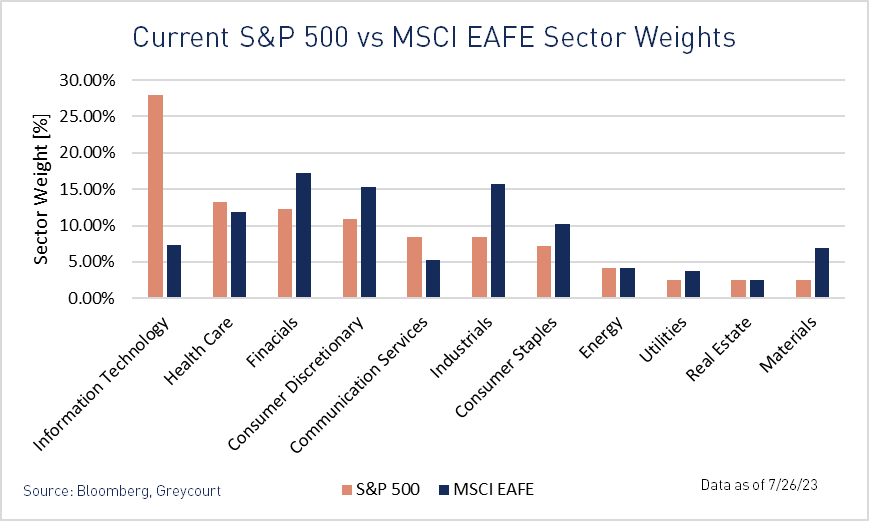
First and foremost, the differences in sector weightings between the two indices are significant. For example, as of July 26th 2023 Information Technology (IT) stocks comprised nearly 30% of the S&P 500 index while they made up only about 7% of EAFE stocks. To isolate the impact that sector weighting differentials have on the valuation of EAFE, we adjusted EAFE’s sector weights to match those of the S&P 500 (“Reweighted EAFE”) and then compared the forward P/E ratios of the reweighted EAFE to the S&P 500 and traditionally weighted EAFE.
As expected, we found that sector weight differences do indeed exert a significant influence on the disparity between the two indices’ forward P/Es. Yet, even after adjusting for sector differences, EAFE still appears historically cheap compared to the S&P 500. This remaining cheapness lies in the relative valuations among each index’s individual sectors. Interestingly, we found that the S&P 500 currently exhibits higher forward P/E ratios across every sector.
Why is this the case? We believe it is because investors are convinced that the US offers superior economic growth prospects driven in large measure by its more robust demographic profile, the highest consumption per capita in the world and an abundance of natural resources. We recognize that both US and EAFE domiciled companies may have global revenues, but on the balance, investors confident in the advantages of the US should be willing to pay a premium for US stocks relative to those located within slower growing developed markets. As a result, the historically high ratio between the forward P/E’s of the two indices does not necessarily indicate that EAFE is a bargain. Rather, it may just mean the US economy promises the potential for higher future revenue and/or profit growth.
If the US economy continues to offer higher growth potential, we believe the S&P 500 will tend to behave like a growth index and EAFE like a value index. These de facto style biases have significant implications for calculating growth and value exposures in a diversified portfolio. Not doing so may lead to unintentionally overweighting growth or value positions within a portfolio.
A simple comparison between the EAFE and S&P 500 shows that the ratio between the two forward P/E’s stands at its highest point since 2006. But to understand why this is the case, we must delve into the composition of each index.
Not surprisingly, the very different sector compositions of these two indices play a significant role in their valuation differences, as shown on the charts on the following pages.
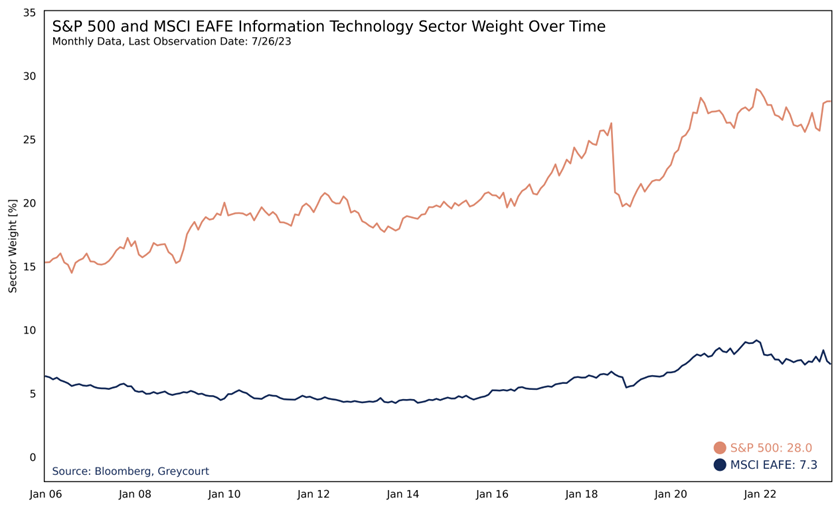
We note that the IT sector weight in EAFE has remained relatively constant since 2006 while the IT weight in the S&P 500 has nearly doubled since then. At 28% of the S&P 500 today, the IT sector is almost 4x greater than its weight in EAFE and accounts for a near record high proportion of the S&P 500.
By contrast, EAFE has higher weights to sectors that are more sensitive to economic cycles, like Financials, Materials, and Industrials. In addition, these sectors exhibit some of the lowest forward P/E ratios among all sectors across both indices. As we consider these sector weight and valuation differences, it becomes clear why the forward P/E of the S&P 500 is so much higher, given that investors value high-growth sectors like IT over slower growing sectors.
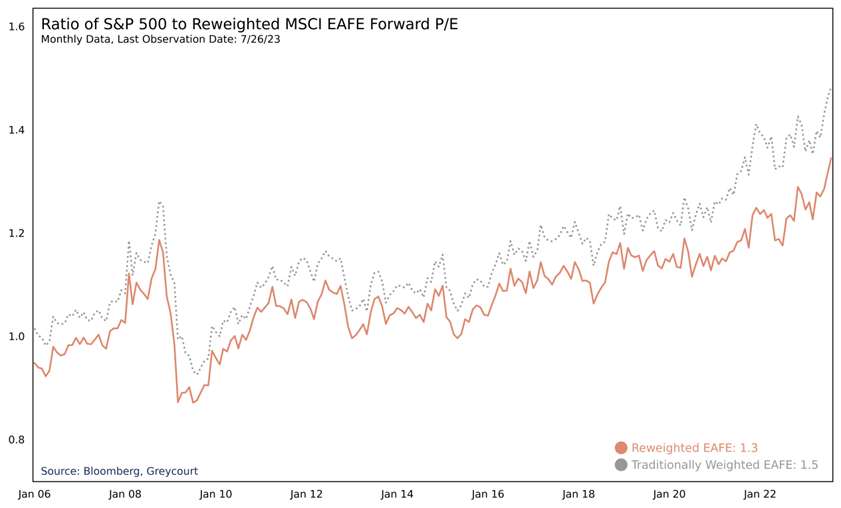
Even when we try to level the playing field by reweighting EAFE to apply S&P 500 sector weights, EAFE still appears cheap. To better understand why the remaining disparity exists, we must examine how the forward P/E of each index is calculated. The calculation is comprised of two components: sector weights, and sector level forward P/E ratios. Each index’s forward P/E is the weighted average of each sector level forward P/E. Because we have already controlled for sector weight differences, all remaining valuation differences must be due to variations between sector forward P/E ratios.
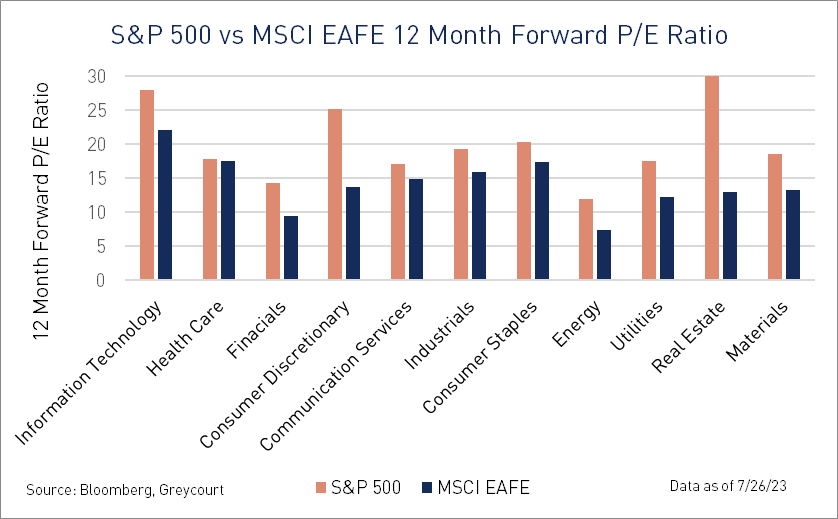
Perhaps unsurprisingly, the chart above shows that the S&P 500 currently exhibits higher forward P/E ratios across all 11 sectors. And, when we look at the S&P 500 versus the reweighted EAFE graph discussed earlier, it becomes clear that the S&P 500 has consistently held higher forward sector P/E ratios over the past 12 years. So why is this the case? Our belief is that the higher sector forward P/E ratios in the S&P 500 are reflective of the perceived advantages of the US economy over other foreign developed economies.
While certainly not a comprehensive list, the following factors provide a basis for advantages that the US holds over most other developed nations:
Some argue that these advantages may not be sustainable and/or that other factors may limit US economic growth in the future. For example, while consumption is a major component that drives the US economy, climate change and its corresponding environmental regulation might broadly increase the cost of goods and reduce the spending power of Americans. Moreover, other factors such as the magnitude of wealth disparity and quality of primary education are significantly worse in the US relative to other developed nations. Whether the US can hold on to its economic and demographic advantages over the long term remains to be seen, yet the historically high premium being placed on US equities indicates that investors believe now more than ever in the growth of the US economy over other developed nations.
Another factor calling into question the sustainability of higher US equity valuations is the S&P 500’s pronounced concentration among a small handful of prominent large-cap stocks. The 10 largest companies in the S&P 500 (including names like Apple, Amazon, Microsoft and Nvidia) command nearly a 30% share of the entire index. By contrast, the 10 largest names in the EAFE index comprise only 15% of its overall composition. While behemoth and highly valued US-based enterprises have been instrumental in driving gains and capturing investor attention, their outsize influence presents a significant risk. A stumble by even a small subset of these firms may cause a disproportionate decline in the relative valuation of S&P 500.
We set out to determine whether developed foreign markets are as inexpensive as they appear based on a simple comparison between MSCI EAFE and the S&P 500 valuations. We showed that differing sector concentrations were a major but not sole cause of the disparity in valuations between the two indices. We note that even when we rebalanced EAFE using S&P 500 sector weights, EAFE remained cheaper. We demonstrated that the remaining valuation difference arises from higher sector level forward P/Es for US companies across all 11 sectors.
We found that comparing the two indices is akin to comparing a growth index to a value index. One can still make the argument that EAFE is cheap, because investors are paying too much for the growth of potential US equities, but determining how much of a premium should be placed on higher-growth US equities is a challenging task and beyond the scope of this paper. One practical takeaway from our research is that we should view EAFE as a value-like index and the S&P 500 as a growth-like index and therefore investors should take these style biases into account when constructing properly diversified portfolios. Failure to do so may result in inadvertently overweighting growth or value exposures.
NOTES
[1] https://data.oecd.org/hha/household-spending.htm#indicator-chart
[2] https://www.statista.com/statistics/748223/leading-countries-based-on-natural-resource-value/